![]()
Un système d'informations géographiques (GIS) est en cours
de réalisation pour la réserve naturelle du Mont Vallier
(Pyrénées), avec une maille de 200x200m. Un programme permet
d'obtenir une représentation des données numériques,
recueillies pour une maille donnée, sur une carte sous forme de
carrés avec une coloration graduée et une échelle
donnée et les données de présence/absence sous forme de
symboles. Les caractéristiques de la distribution des marmottes de cette
réserve ont été cartographiées. Ce système
rendra possible la modélisation de la distribution spatiale des
paramètres écologiques et de la faune et flore sauvages et
permettra ainsi le contrôle de la distribution et de l'abondance et la
prédiction de leurs modifications futures.
Mots clés : Marmotte alpine, Marmota marmota, cartographie, distribution spatiale, système d'information géographique,
Pyrénées, protection.
A geographic information system (GIS) is in process for the Mount
Vallier Nature reserve (Pyrenees) with a 200x200 m field mesh size. The aim of
this project is to draw symbolic representation of data on a previously drawn
map. Data collected for each mesh are represented as a black or white or
in-between square on the map, according to its value with a given scale.
Presentation of data can be realized in black and white or in colours.
Presence/absence data can be represented with symbols. Characteristic
parameters of marmot distribution in the Mount Vallier reserve were mapped.
This system will allow modelling of the spatial distribution of the variables,
then an efficient monitoring of distribution and abundance and a prediction of
their future changes.
Key words: Alpine marmot, Marmota marmota, cartography, spatial distribution, Geographic Information System, Pyrenees, conservation.

La représentation de la distribution spatiale de la faune et flore sauvages et de leurs modifications éven-tuelles au cours du temps est importante pour les gestionnaires des milieux naturels. Un tel système d'informations géographiques (GIS), en développement pour la réserve naturelle du Mont Vallier (Pyrénées) devrait permettre de suivre la colonisation des mar-mottes réintroduites (Nebel & Franc 1992, Ramousse et al. 1993). Le but de ce travail est de décrire un logiciel permettant de dessiner des représentations symboliques de données sur des fonds de carte.
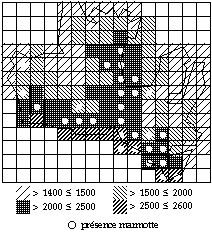
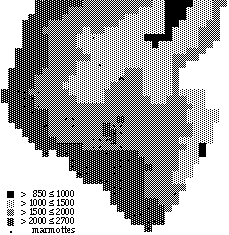
Le programme est rédigé en BASIC. La carte, tracée avec un logiciel de dessin (Mac Draw ou Canvas) est sauvegardée au format Pict, avec une dimension maximum de 240x240 mm. Les données sont enre-gistrées dans un fichier au format "texte" et représentent un tableau à n1 colonnes (différentes variables étudiées ou présence-absence de certains attributs) x n2 lignes (longitudes). Chaque case du tableau représente, par exemple, une parcelle de 200x200m sur le terrain et pourra être figurée sur la carte sous la forme d'un carré de 4x4mm (échelle 1/50.000), représenté par un gris plus ou moins foncé selon la valeur de la variable contenue dans la colonne. La limite supérieure acceptée est donc de 3600 carrés de 4x4 mm. Trois échelles sont préprogrammées en plus d'un choix libre. La représen-tation des données peut se faire en noir et blanc ou en couleurs et dans chaque option sous forme de figurés ou de symboles. On peut obtenir, en noir et blanc, des pointillés plus ou moins denses (8 combinaisons possibles) et en couleurs, des combinaisons de 2 couleurs, une de fond et une de premier plan, parmi 8 couleurs possibles (blanc, noir, rouge, vert, bleu, jaune, magenta, cyan) avec 5 nuances possibles de 0 à 100% de couleur de fond par pas de 25%) ou des dégradés de noir. Dans les deux cas (couleurs et N/B), on peut représenter les présences en utilisant des symboles (une marmotte par exemple). Dans ce cas, le symbole doit se trouver dans un fichier Pict. La représentation est tracée à l'écran et on peut l'imprimer et/ou l'enregistrer dans un fichier Pic modifiable ensuite sous Mac Draw par exemple.
Ce programme a été utilisé pour étudier les caractéristiques de la distribution de la population de marmottes du Mont Vallier (Figures 1 et 2). Un tel système d'informations géographiques (GIS) rendra possible la modélisation de la distribution spatiale d'une espèce permettant ainsi le contrôle efficace de sa distribution et de son abondance et la prédiction de ses modifications futures (Buckland & Elston 1993).
The ability to represent spatial distribution and change in distribution of wildlife is of considerable importance in wildlife management. Such a Geographic information system (GIS) is in progress in the Mount Vallier Nature Reserve (Pyrenees) and will allow to understand colonization process of reintroduced marmots (Nebel & Franc 1992, Ramousse et al. 1993), example of a species expanding its range. The aim of this work is to describe a software to draw symbolic representation of data on previously drawn maps.
This programme was written in BASIC. The original map, obtained by use of a drawing progamme (such as Mac Draw or Canvas), is a Pict file, with maximal dimensions of 240x240 mm. Data, which represent an array having n1 columns (variables or presence-absence of some characteristics) and n2 rows (longitudes for instance), are stored in a text file. Each cell of the array corresponds, for instance, to a 200 x 200 meter quadrat in the field, which could be represented as a 4x4mm square on the map (scale: 1/50,000). The square could be black or white or in-between, according to the value of the variable corresponding to the column. Three predefined scales for the squares are available and one other scale can be defined. Presentation of data can be realized in black and white or in colors, under each option either with variation of intensity or symbols. Eight different densities of points can be used in black and white presentation and two tints, a background colour and a forecolour, with 8 possible colour (white, black, red, blue, yellow, magenta and cyan) and with 5 possible gradations of the background colour, in coloured presentation. In both cases (black and white or colours), presence can be represented with symbols (a marmot for instance). The symbol must be in a Pict file. The map is drawn on the screen and can be printed and/or saved in a Pict file and modified using Mac Draw for instance.
This programme has been run to study the charateristic parameters of the spatial distribution of the marmot population of Mont Vallier (Figures 1 and 2). Geographic information system (GIS) will allow modelling of the spatial distribution of the species, then an efficient monitoring of their distribution and abundance and a prediction of their future changes (Buckland & Elston 1993).
BIBLIOGRAPHIE
/ REFERENCES
BUCKLAND S.T. & D.A ELSTON 1993. Empirical models for the spatial
distribution of wildlife. J. Applied Ecol., 30: 478-495.
NEBEL D. & FRANC R. 1992. The introduction of the marmot (Marmota
marmota) into the Mont-Valllier nature reserve, and the history of its
subsequent colonisation between 1961 and 1991. In Proc. 1st Intern. Symp. on
Alpine marmot, Bassano B., Durio P., Gallo Orsi U., Macchi E. eds,
253-255.
RAMOUSSE R., LE BERRE M., NEBEL D. & L. LE GUELTE 1994. Introduction de la
marmotte alpine dans la réserve du Mont Valier : premier bilan. In
2ème Journée d'étude sur la Marmotte Alpine,
Ramousse R. & Le Berre M. eds., 49-54.
A suivre
Forward![]()
| Retour à Documents scientifiques du réseau | Back to Scientific publications of the network |
| sommaire/contents |